Activity chart
The chart can be viewed both in the watch app and in the “Stand up alert” section of the Bubble Cloud app:
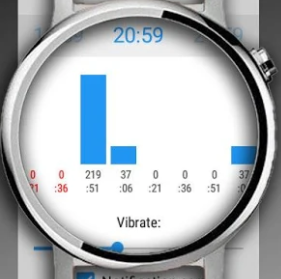
The chart shows you how many steps were detected in the last 2 hours (in 15 minute resolution). “:51” is minutes of the hour, the value on top is the step count. You can touch the columns in the chart, and it will give you a little bit more explanation.
This chart is intended to help the initial setup, where you can work out the hourly limits. This is only necessary, because there are always a bunch of falsely detected steps. So you work at your desk for an hour, and then you can see it still detected 12 steps in each 15 minutes on average. So you can set your reminder to 60 minutes and 50 steps. If less than 50 is detected it will remind you.
Colors in the chart
red = no stand up monitoring (while the watch is being charged for example) numbers turn red in activity chart: time slots considered “done”, you don’t need to meet a “moving step count”, time slots outside your “active hours” are also marked with red
blue = after you disconnect the charger (or dismiss the stand up notification) it will not remind you for the amount of time you set. If you have 30 minutes configured and disconnect the charger, the next two time slots (15 + 15 minutes) it will keep track of your steps, but will only start to remind you if the 30 minutes is up